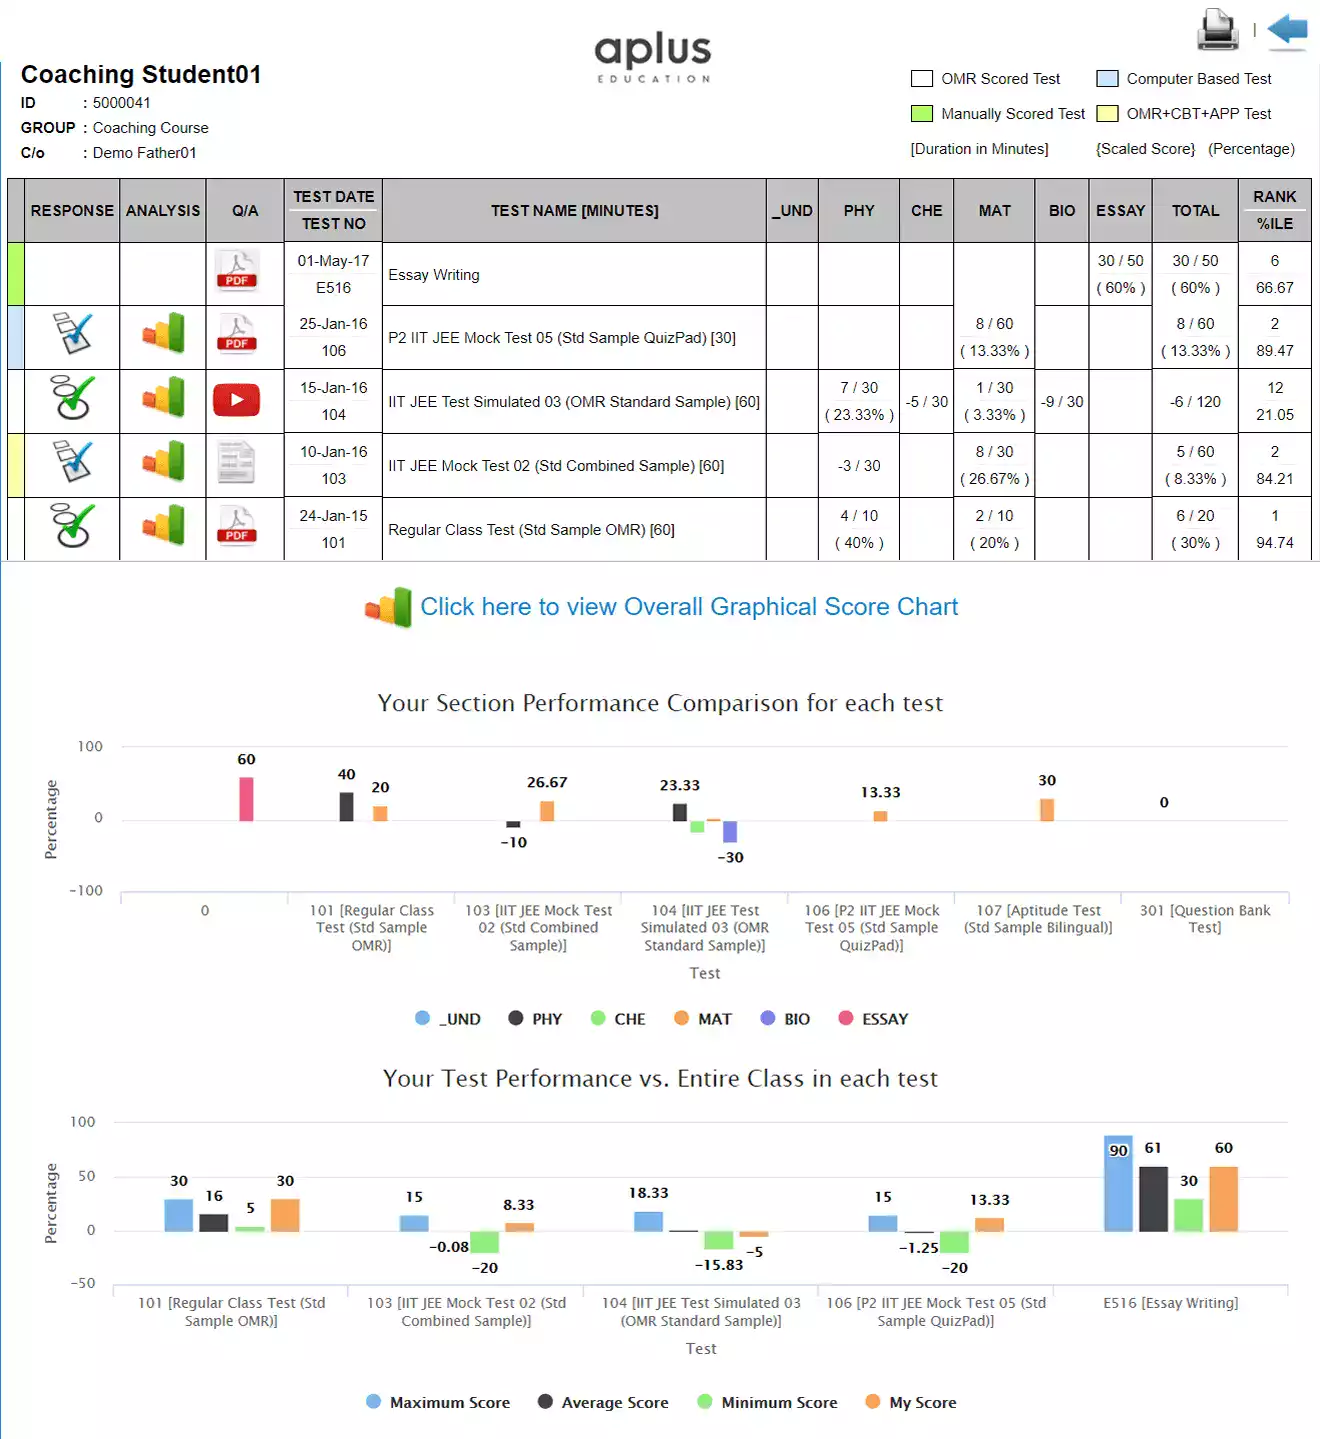
Candidate Name, Father’s Name, Unique ID of candidate, Candidate Group in which he is enrolled.
Scores of each subject in all the test are displayed in a table. Each row in the table belongs to a single test with percentage and percentile of each subject in each test. In case of tests with scaled scores, the scaled score values are displayed in place of raw scores. Each row has several icons that allow to draw more detailed reports.
OMR Sheet/ Time Record: In case of Test Scores uploaded for OMR software, the OMR sheet of the candidate can also be uploaded. In case of Online Exams, where there is no OMR sheet, the candidates time stamp of attempting each question can be seen.
In case of Online Exam there are no OMR sheets, so the dashboard displays the timestamp of questions along with candidate responses and correct answerkey of each question.
Question Review: It is possible to show complete Question paper along with Hint solution and description for each question or it is possible to display selective question to the candidate which he answered wrongly. This provision can be enabled disabled or controlled as per settings.
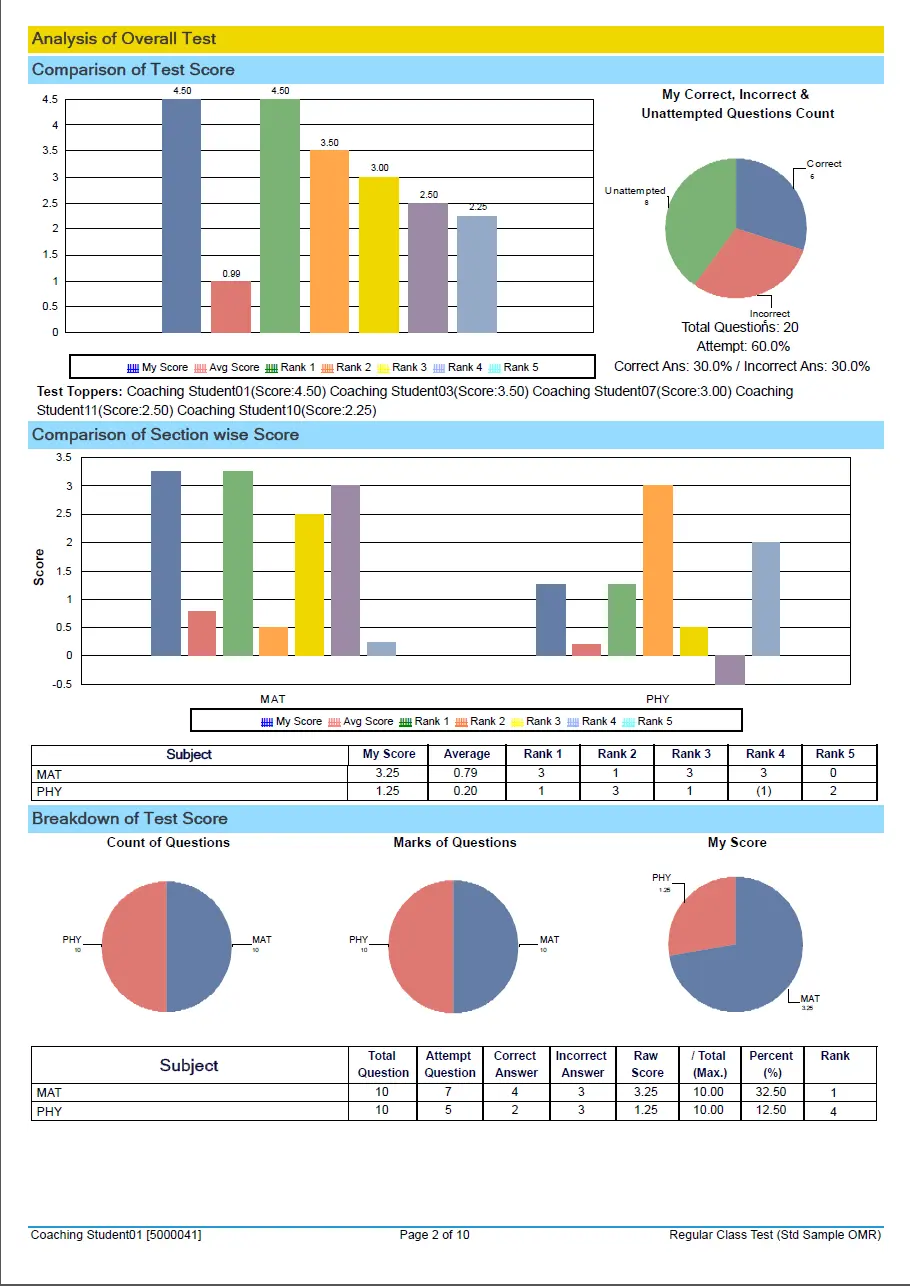
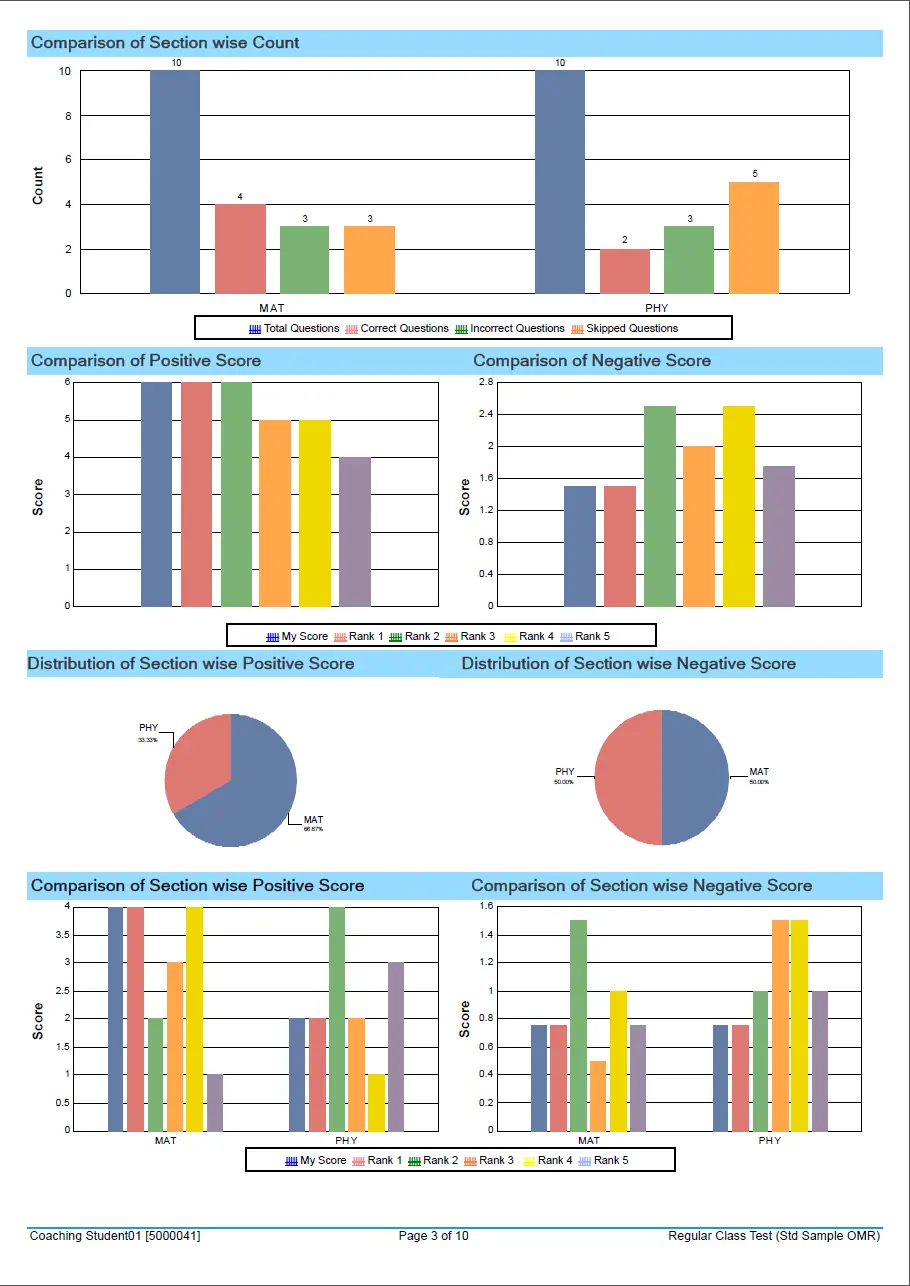
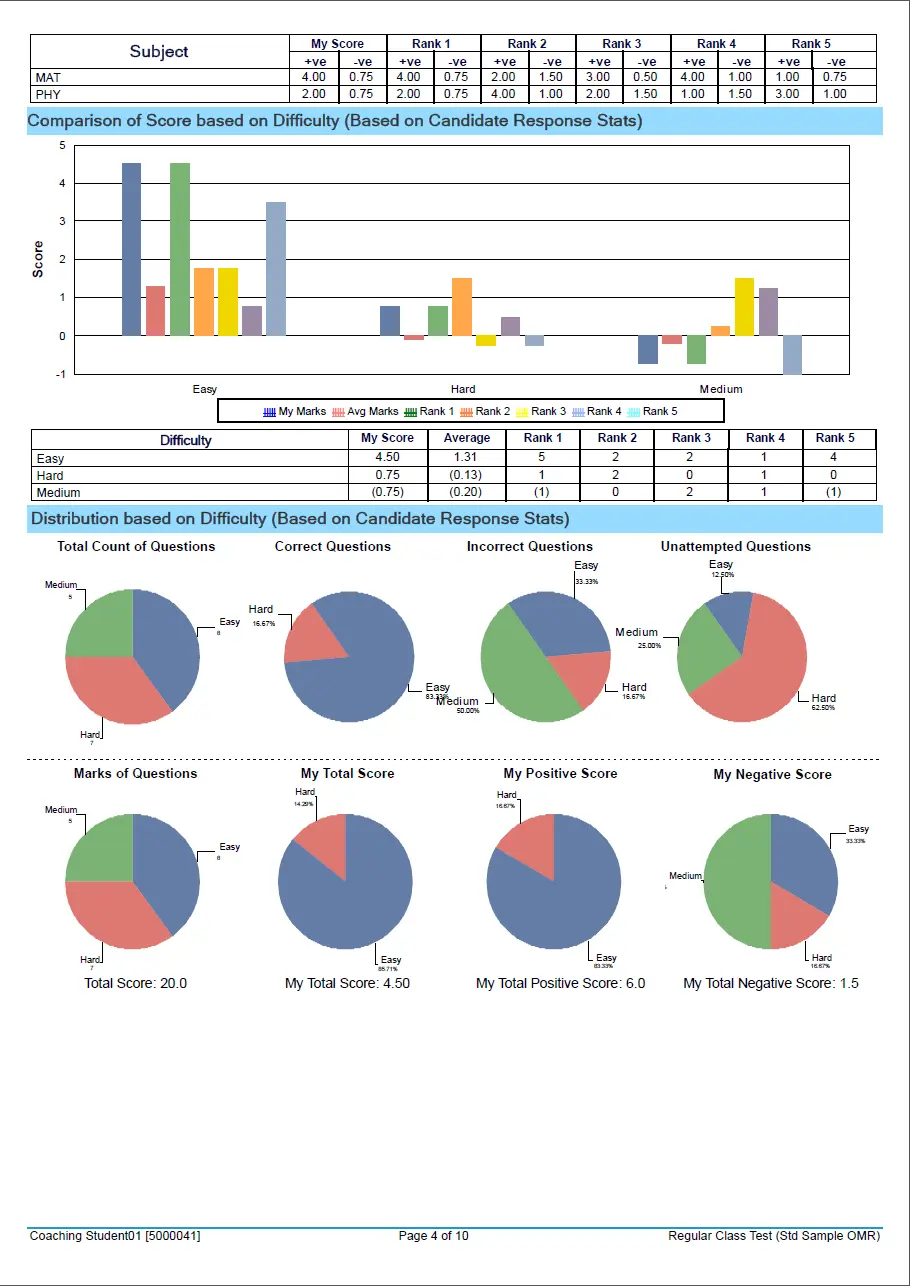
The Assessment Report Drawn from the Online Score Board is a detailed multipage graphical report which presents a detailed critical analysis of the candidates performance in a test based on overall score sectional score and sub-sectional score compared with average and top scores and the scores achieved on questions with various difficulty levels etc.
There are dynamic graphs available in the candidate dashboard which depict the candidates growth over several tests.
The Subject wise progress bar graph is plotted with the bars depicting the percentage score plotted for each subject in each test attempted by the candidate. It is possible to dynamically change the graph parameters to compare one or more selective subjects.
The other dynamic graph available on the candidates result dashboard compares the students overall score in several tests with the respective toppers and average score in each test. This graph can also be dynamically altered such that candidate score is compared only with only the average or topper scores.
It is possible to print a summary of scores which are displayed on the online result dashboard along with brief subject wise progress graphs. The complete dashboard preview can also be printed along with dynamic graph capture.
The online Score board also has a Android App interface. So if the APP has been developed for your account then the users can also see the same results from their App.
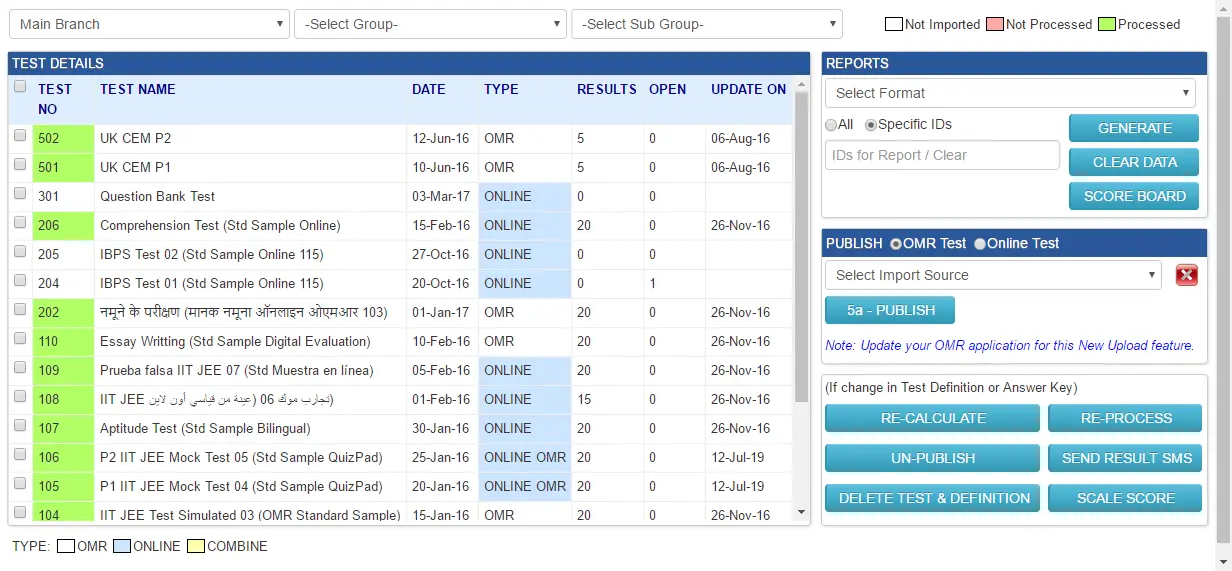
The Administrator dashboard is the interface accessed by the administrator to generate score and assessment reports for multiple candidates.
The score board has access control, in which admin of a specific branch or group can view the list of tests made only for that branch or group. Even if a test is made for multiple branches or multiple groups, still only the students of a particular group will be considered to draw reports of that test if the specific branch/group administrator is logged in.
It is possible to access individual students dashboard without using the password.
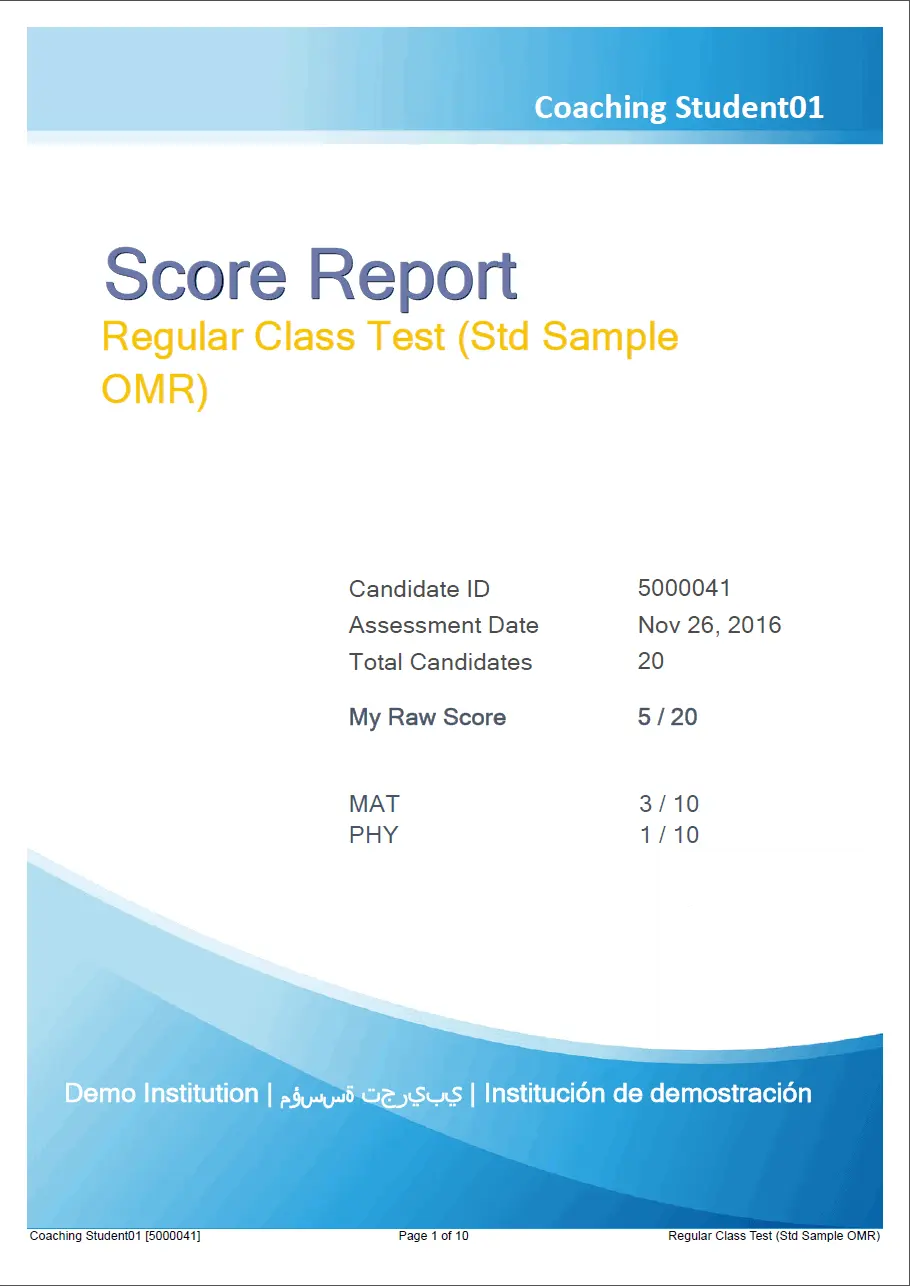
This Graphical Test Assessment Report is drawn for one or more candidates. This is the same report as drawn from the candidates dashboard for an individual candidate. But from the Administrator’s dashboard the same assessment report can be drawn for multiple candidates.
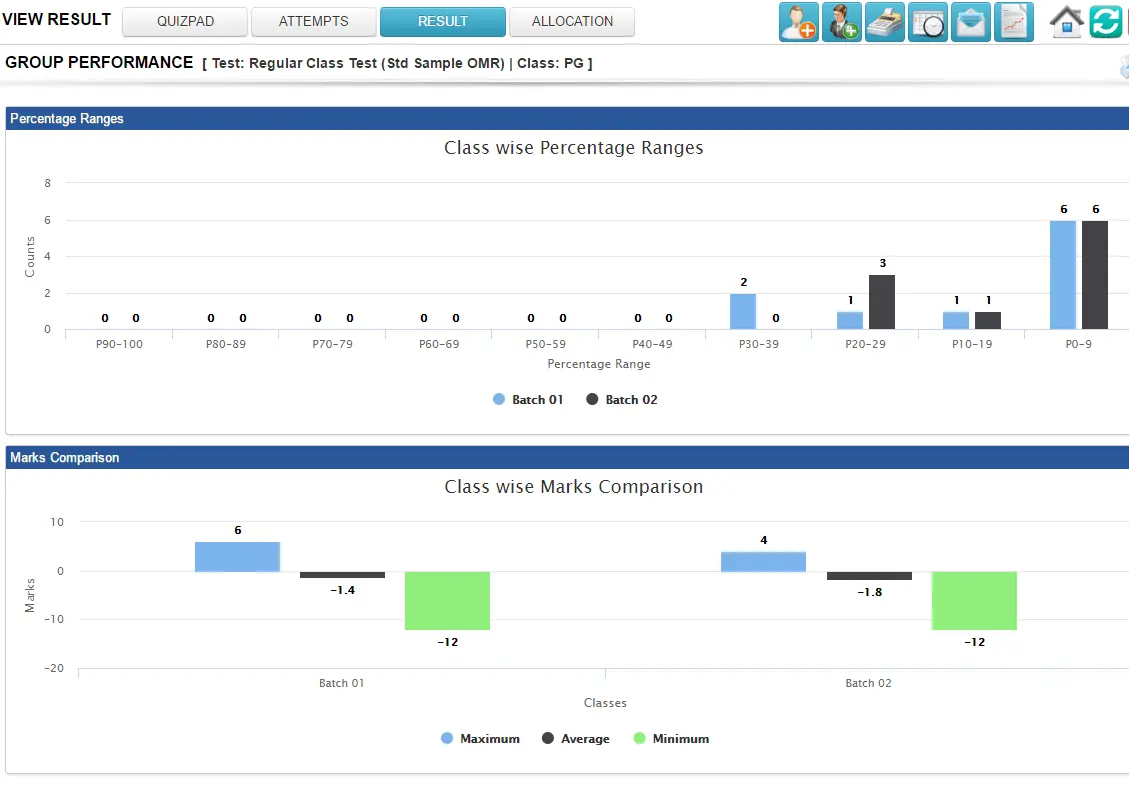
This report compares the performance of one batch with others. These are dynamic bar graphs which depict the number of candidates from each group that fall between a particular score range. One or more groups can be put off to compare between specific groups.
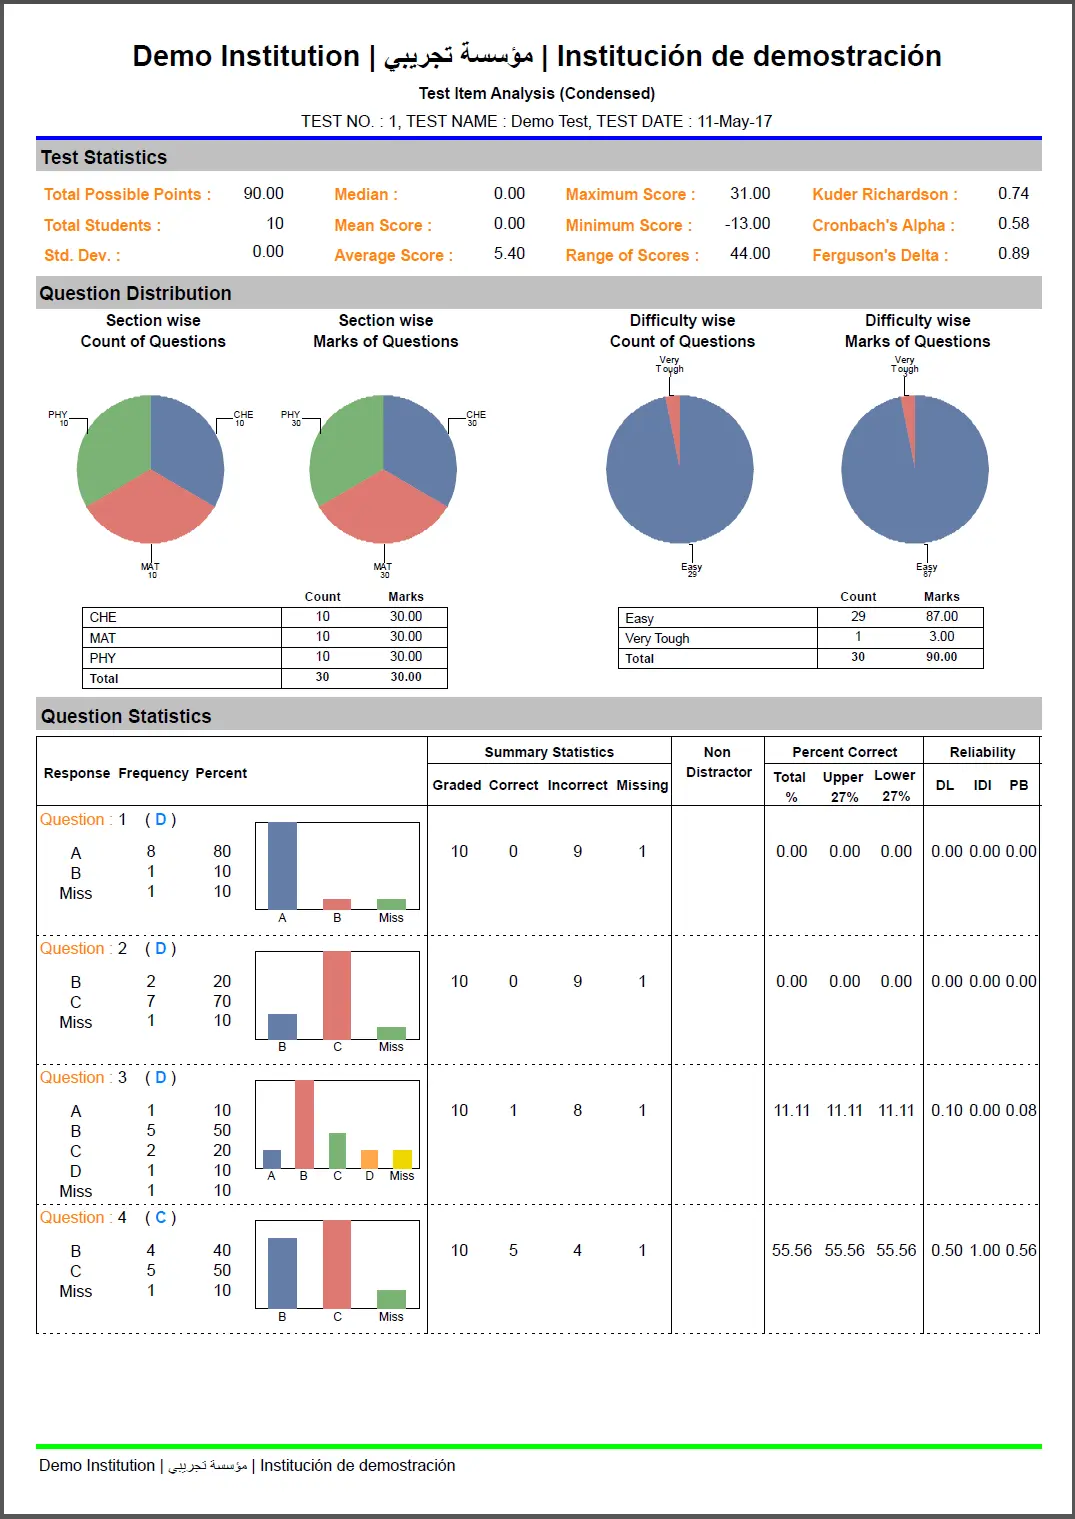
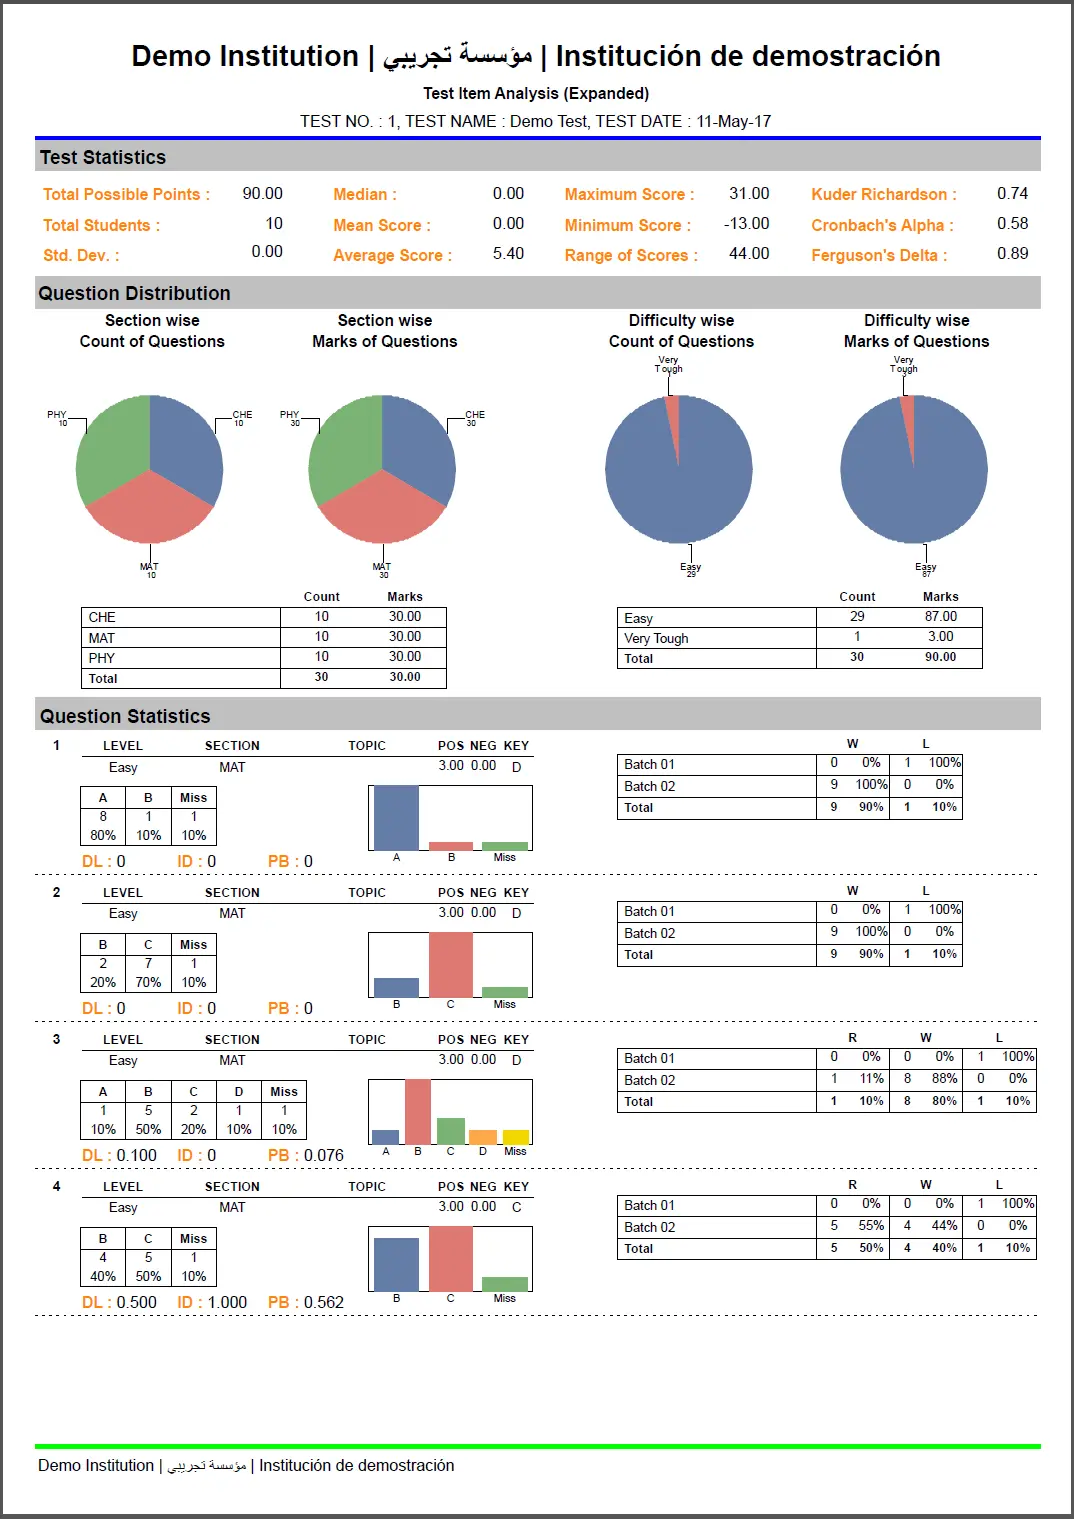
Delivers question by Question Analysis It is also called the Item Analysis report. There are two variants of the Question Paper Analysis Report. The expanded Question Paper Analysis Report and the Condensed Report. Screenshots of the both variants are provided below.
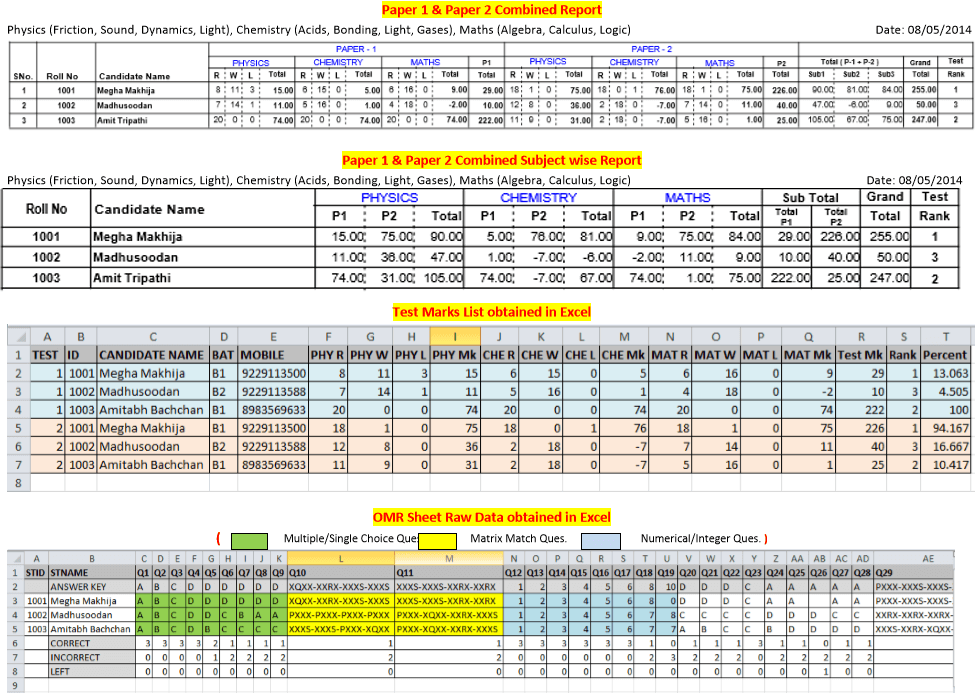
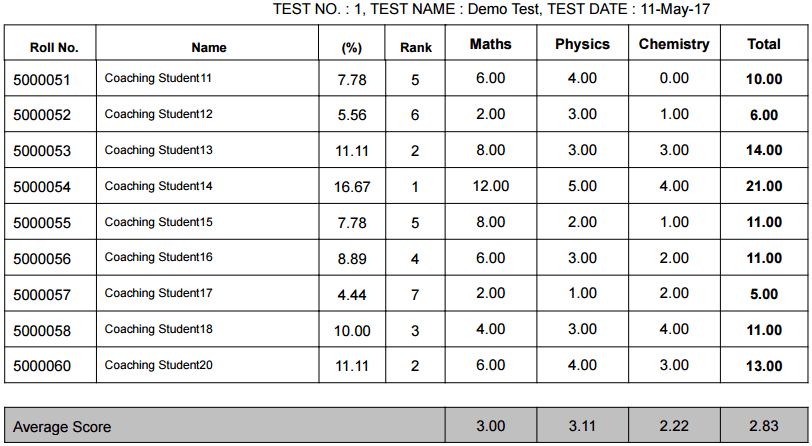
The preview of the standard formats of all reports is also available against that report option.
allows to keep a watch on the candidate participation in an Online Exam. It gives you a correct picture of the number of students opening a test, the students who are in the process of answering but have not completed the test and the students who have finally saved the test.
allows the administrator to discuss a live test in the class. The question is displayed on teachers laptop and the students answer the test on their respective devices. The live stats of students responses is displayed on the administrator’s screen. The feature prevails where the section time setting is on.
Read more:Addmen Group Copyright 2024. All Rights Reserved.